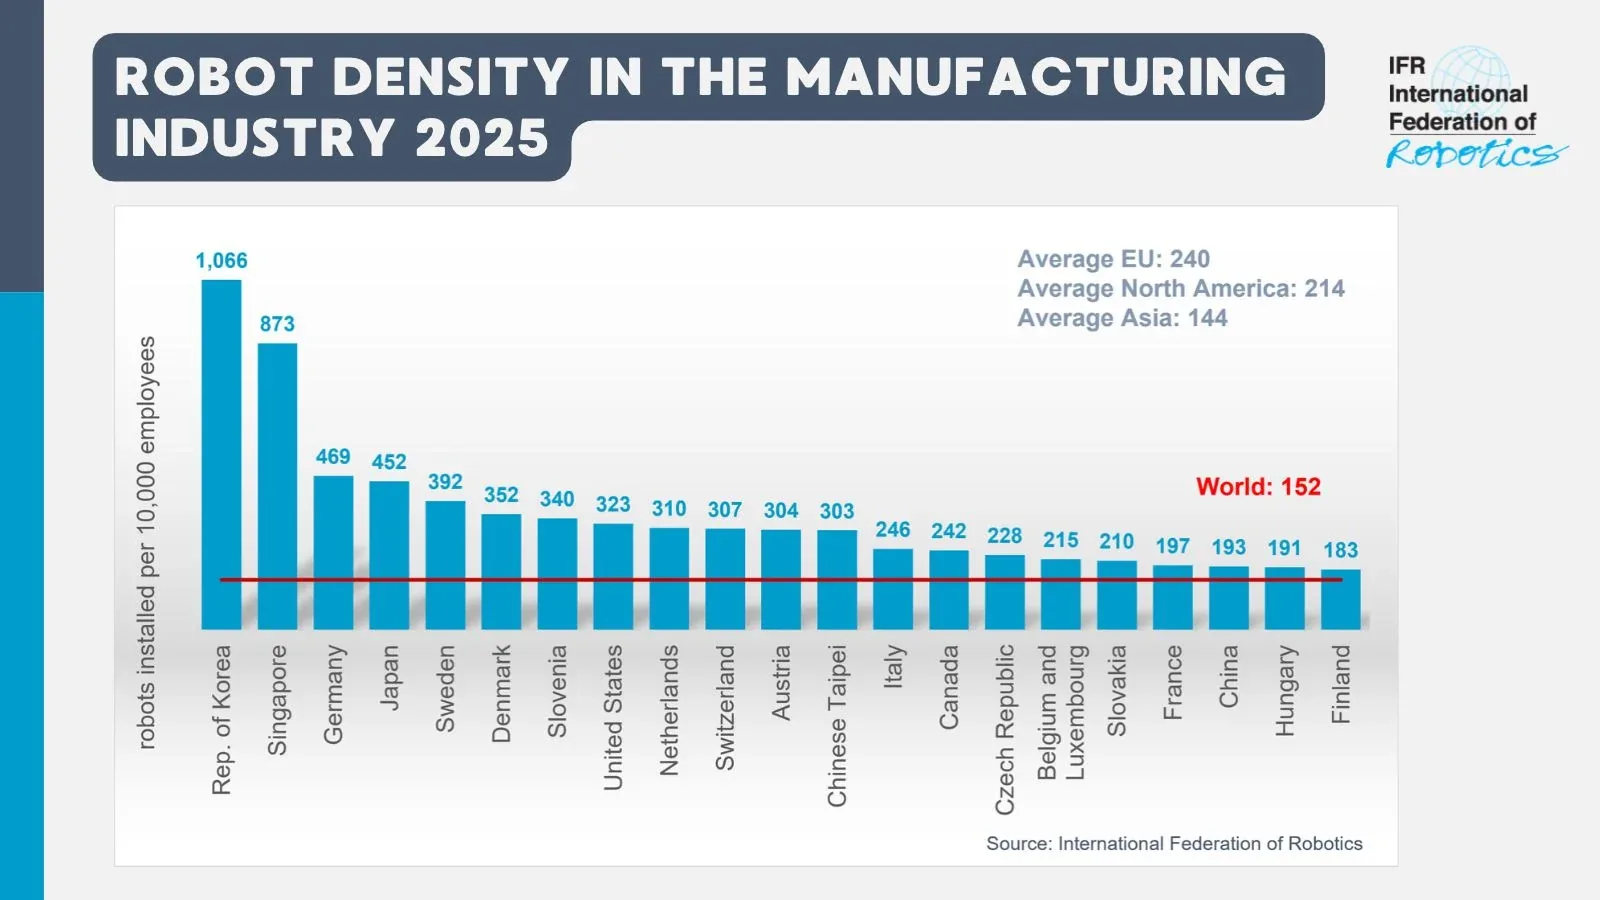
The International Federation of Robotics released its 2026 robot density rankings on November 12, showing South Korea at 1,066 industrial robots per 10,000 manufacturing employees, ahead of Singapore at 873 and Germany at 469. The global average climbed to 162 units per 10,000 employees, a new record, according to IFR president Jane Heffner.
How is robot density actually measured, and why does it matter?
Robot density compares the number of operational industrial robots to every 10,000 workers in the manufacturing sector, which lets the IFR line up economies of very different sizes on the same scale. A country with a small manufacturing workforce but heavy automation, like South Korea or Singapore, can rank far above a country with a much larger absolute robot count but a bigger labor base.
"Tracking robot density creates a level playing field for global analysis by adjusting the number of operational industrial robots against every 10,000 employees in the manufacturing sector," Heffner said. That framing is why density, not total installed units, is the figure most industry forecasters cite when comparing automation intensity across countries.
Which countries and regions are rising fastest?
China is the standout mover rather than the leader: its density reached 193 units per 10,000 employees, ranking 19th globally, but that figure represents 147% growth since 2020, by far the fastest pace among major manufacturing economies. Asia as a whole grew 47% over the same period to reach 144 units, just below the new global average.
North America grew a more modest 24% to 214 units, and the EU-27 grew 35% to 240 units. Japan, long an automation leader, now sits at 452 units, behind Germany and well below South Korea and Singapore, suggesting its early lead in industrial robotics has narrowed relative to faster-growing adopters.
What does this data signal for the industrial robot market?
The widening gap between South Korea and Singapore at the top and the 162-unit global average shows automation adoption remains concentrated in a handful of economies rather than spreading evenly. That concentration lines up with where humanoid and industrial robot investment is also landing: South Korea just committed $330 million to localize humanoid component supply chains, while China's component makers have drawn outsized funding this year even as the country's density ranking stays mid-table.
For manufacturers elsewhere, the data is a reminder that density gaps translate into labor-cost and throughput gaps. The United States, at 323 units per 10,000 employees, trails not just South Korea and Singapore but also Germany and Japan, a positioning that analysts have cited when discussing why humanoid robot adoption in US factories is being watched closely as a potential catch-up mechanism.
What should readers watch for in next year's figures?
The IFR typically updates density rankings annually using the prior year's installation data, so the next release will show whether China's 147% five-year growth rate is sustained or whether its humanoid and industrial robot investment surge in 2026 shows up as an even sharper jump. Watch too for whether South Korea's new component-localization funding shows up as accelerated density growth in categories tied to humanoid and collaborative robots specifically, rather than only traditional fixed-arm industrial robots.